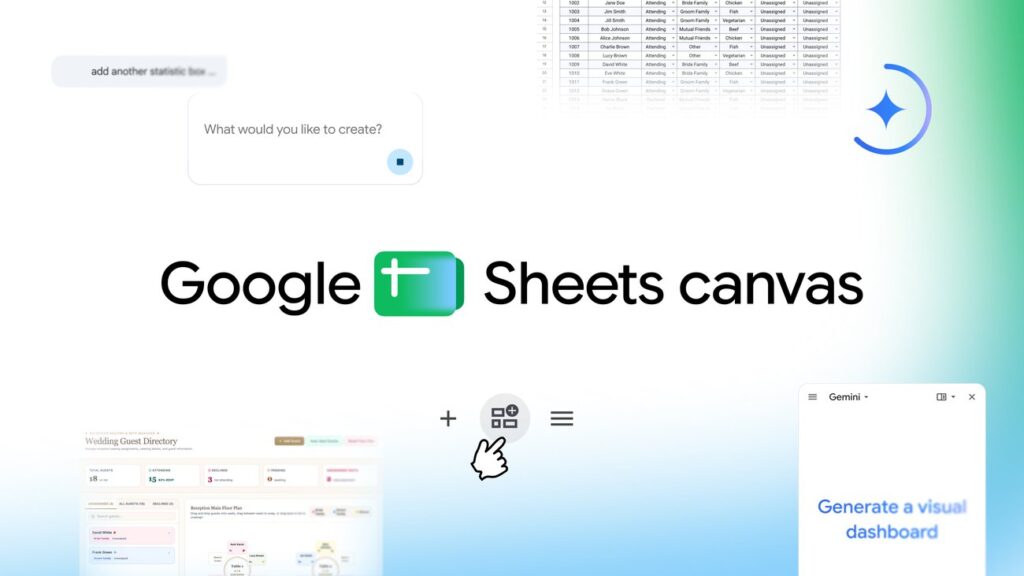
Google has added a new feature to Google Sheets that lets users turn raw data into custom, interactive mini-apps using Gemini. This tool, called Sheets canvas, allows people to describe what they want in plain English and have the system build a visual interface on top of their existing rows and columns.
How the feature works
The canvas sits directly on top of the spreadsheet data as a read-write layer. Users can organise, edit, and navigate information in any layout they prefer without needing to write code or build complex formulas.
Key capabilities
- No coding needed: Describe the desired outcome, such as “create a visual study tracker”, and the system builds it.
- Real-time syncing: Changes made to the canvas or the underlying sheet update instantly between both views.
- Easy refinement: Users can ask Gemini to adjust the layout, design, or functionality at any time.
- Collaboration: The canvas appears as a tab within Google Sheets, meaning it can be shared with others just like a standard spreadsheet.
Use cases
The system is designed to be flexible enough to handle various personal and professional tasks.
Managing schoolwork
Students can convert long lists of assignments into an interactive study aid. The interface allows them to track progress, set reminders, and visualise the week ahead to ensure no deadlines are missed.
Fantasy football
Managers can build a custom dashboard to track player performance and compare stats side by side. The tool uses the data in the sheet to visualise the path to winning the championship.
Wedding planning
Organisers can transform guest RSVP data into an interactive seating chart. Users can drag and drop guests to their tables while knowing the central sheet remains up to date.
Availability
Sheets canvas is available globally in English to Google AI Pro and Ultra subscribers. It is rolling out today to Google Workspace customers on Business or Enterprise Standard and Plus plans, as well as to Google AI Pro for Education add-on subscribers.
To start, open a Google Sheets spreadsheet and select the “Create canvas” option in the Ask Gemini side panel.
What it means
This update removes the technical barrier between data and presentation. Users no longer need to rely on static tables or complex formula structures to display information. By allowing natural language prompts to generate interfaces, the tool shifts the focus from building the view to simply defining what needs to be seen. This should reduce the time spent formatting reports and allow more attention on the data itself.