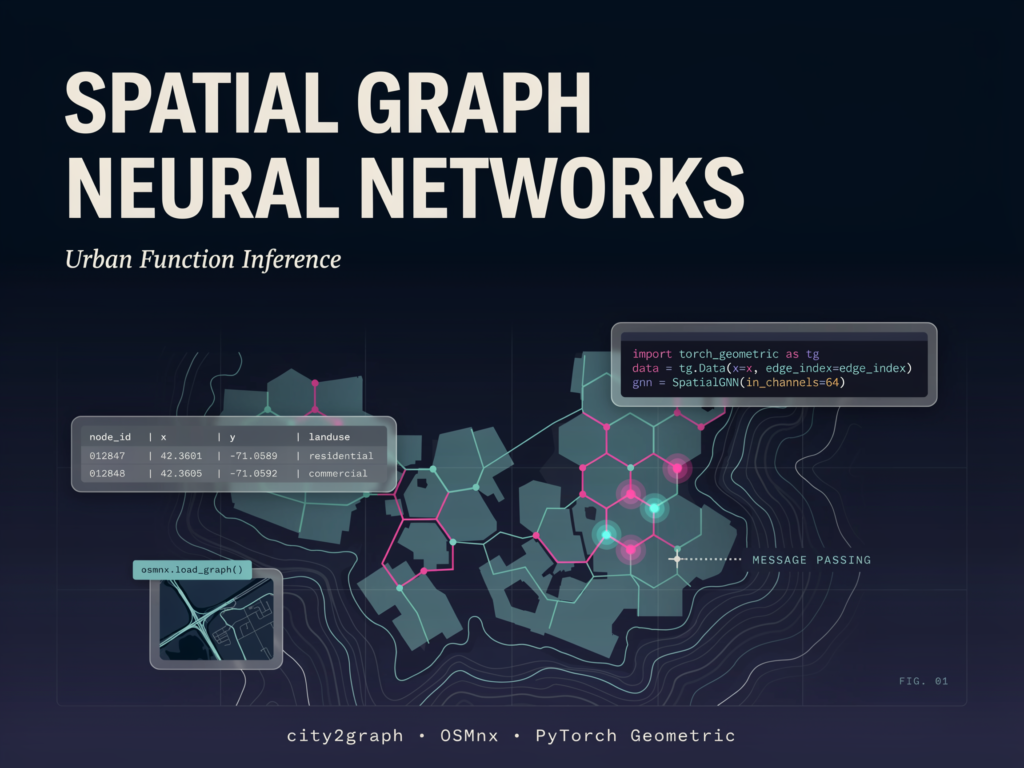
For makers and artists working with urban data, the ability to infer the function of a city block purely from its spatial structure is a powerful tool. By treating Points of Interest (POIs) as nodes in a graph, we can train models that recognise patterns in how businesses cluster, regardless of their specific names. This workflow demonstrates how to build a robust pipeline using city2graph, OSMnx, and PyTorch Geometric to predict urban functions like retail or education based on proximity and density.
Setting up the environment
We begin by installing the necessary libraries for geospatial data handling and graph neural networks. It is critical to verify that city2graph and PyTorch Geometric are present before proceeding. To ensure that the graph construction, data splitting, and training results are reproducible, we set a fixed random seed.
Collecting data with a synthetic fallback
The tutorial targets the Shibuya district in Tokyo, extracting real POI data and the walkable street network. We categorise locations into broad urban functions: food, retail, education, and health. If the request to OpenStreetMap fails-perhaps due to network issues or API limits-the script automatically generates a synthetic dataset. This fallback creates clustered points near the target coordinates, ensuring the workflow remains functional even without live data access.
Once acquired, the data is projected into a metric coordinate system (UTM) to allow for accurate distance calculations. We then sample the dataset to ensure a manageable size for training, typically capping it at 700 points.
Engineering features and comparing graph topologies
Before feeding data into a model, we must engineer meaningful spatial features. For each POI, we calculate its projected coordinates, local point density, and the distance to the nearest street segment. These features capture the essence of an urban environment: where things are, how crowded they are, and how well they are connected to the transport network.
We then construct several families of proximity graphs to see how different mathematical strategies represent the same physical space. The options include:
- K-Nearest Neighbours (KNN): Connects each point to its closest k neighbours.
- Delaunay: Creates a triangulation of the points.
- Gabriel and Relative Neighborhood Graphs (RNG): Filters edges based on geometric constraints.
- Euclidean Minimum Spanning Tree (EMST): Connects all points with the minimum total edge length.
- Waxman: Adds probabilistic edges based on distance and a connectivity parameter.
We compare these structures by analysing their edge counts and average node degrees. Visualising these topologies reveals how a simple KNN graph differs significantly from a sparse Minimum Spanning Tree, highlighting the trade-offs between connectivity and sparsity.
Building heterogeneous and homogeneous graphs
The final stage involves converting the processed data into a format suitable for Graph Neural Networks (GNNs). We create both heterogeneous graphs, where nodes retain their specific category identities (e.g., ‘restaurant’ vs ‘school’), and homogeneous graphs, which treat all nodes uniformly.
Using city2graph, we map the node features-coordinates, density, and street distance-into the PyTorch Geometric framework. We also generate bridge edges between different node types to allow information to flow across categories. The resulting data structures, such as HeteroData, are ready for training a GraphSAGE model to infer the function of urban spaces.
Key takeaways
- Robustness matters: Implementing a synthetic data fallback ensures that geospatial machine learning workflows are reliable, even when external data sources like OpenStreetMap are temporarily unavailable.
- Topology shapes inference: Different graph construction strategies (KNN, Delaunay, Waxman) create distinct connectivity patterns, and choosing the right one is critical for capturing the correct spatial relationships in urban environments.
- Feature engineering is key: Simple geometric features like local density and distance to the street network provide the necessary context for Graph Neural Networks to accurately predict the function of Points of Interest.